5,000 Years of Interest Rates, Part II
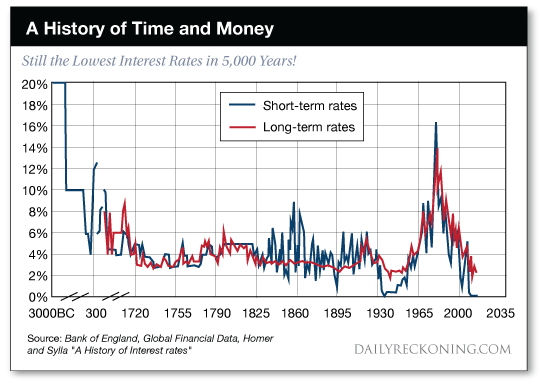
Yesterday we hauled out evidence that interest rates have gone persistently down 500 years running.
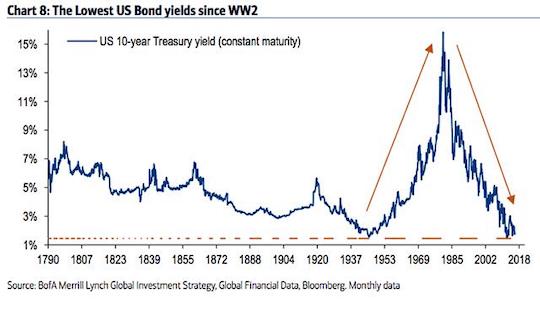
And the high interest rates of the mid- to late 20th century?
These may be history’s true aberration, a violent but brief lurch in the chart… like a sudden burst of blood pressure.
Let us here reintroduce the graphic evidence:

Here is an extended picture of downward-trending rates — with the fabulous exception of the mid-to-late 20th century.
As Harvard economics professor Paul Schmelzing reckoned yesterday, as summarized by Willem H. Buiter in Project Syndicate:
Despite temporary stabilizations such as the periods 1550–1640, 1820–1850 or in fact 1950–1980… global… real rates have persistently trended downward over the past five centuries…
Can you therefore expect the downward journey of interest rates to proceed uninterrupted?
We have ransacked the historical data further still… rooted around for clues… and emerged with worrisome findings.
Why worrisome?
Details to follow. Let us first look in on another historical oddity, worrisome in its own way — the present stock market.
A Lull on Wall Street
It was an inconsequential day on Wall Street. The Dow Jones took a very slight slip, down nine points on the day.
The S&P scratched out a single-point gain; the Nasdaq gained 12 points today.
Gold and oil largely loafed, budging barely at all.
Meantime, humanity’s would-be saviors remained huddled at Davos. There they are setting the world to rights and deciding how we must live.
But let us resume our study of time… and money.
For light, we once again resort to the good Professor Schmelzing.
The arc of interest rates bends lower with time, he has established. But as he also establishes… no line bends true across five centuries of history.
Put aside the drastic mid-to-late 20th century reversal. Even the long downturning arc has its squiggles and twists, bent in the great forges of history.
To these we now turn…
“Real Rate Depression Cycles”
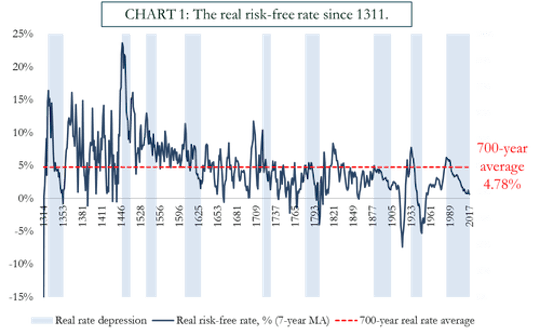
Over seven centuries, Schmelzing identifies nine “real rate depression cycles.”
These cycles feature a secular decline of real interest rates, followed by reversals — often sudden and violent reversals.
The first eight rate depression cycles tell fantastic tales…
They often pivoted upon high dramas like the Black Death of the mid-14th century… the Thirty Years’ War of the 17th century… and World War II.

The world is currently ensnared within history’s ninth rate depression cycle. This cycle began in the mid-1980s.
Schmelzing says one previous cycle comes closest to this, our own. That is the global “Long Depression” of the 1880s and ’90s.
This “Long Depression” witnessed “low productivity growth, deflationary price dynamics and the rise of global populism and protectionism.”
Need we draw the parallels to today?
It is here where our tale gathers pace… and acquires point.
A Thing of Historic Grandeur
Schmelzing’s research reveals this information:
This present cycle is a thing of historical grandeur, in both endurance and intensity.
Of the entire 700-year record… only one cycle had a greater endurance. That was in the 15th century.
And only one previous cycle — also from the same epoch — exceeded the current cycle’s intensity.
By almost any measure… today’s rate depression cycle is a thing for the ages.
Turn now to this chart. The steep downward slope on the right gives the flavor of its fevered intensity:

Schmelzing’s researches show the real rate for the entire 700-year history is 4.78%.
Meantime, the real rate for the past 200 years averages 2.6%.
Beware “Reversion to the Mean”
And so “relative to both historical benchmarks,” says this fellow, “the current market environment thus remains severely depressed.”
That is, real rates remain well beneath historical averages.
And if the term “reversion to the mean” has anything in it, the world is in for a hard jolt when the mean reverts. Why?
Because when rates do regain their bounce — history shows — they bounce high.
Schmelzing:
The evidence from eight previous “real rate depressions” is that turnarounds from such environments, when they occur, have typically been both quick and sizeable… Most reversals to “real rate stagnation” periods have been rapid, nonlinear and took place on average after 26 years.
Twenty-six years? The present rate depression cycle runs to 36 or 37 years. We must conclude it goes on loaned time. What happens when the loan comes due?:
Within 24 months after hitting their troughs in the rate depression cycle, rates gained on average 315 basis points [3.15%], with two reversals showing real rate appreciations of more than 600 basis points [6%] within two years.
The current rate depression cycle ranges far beyond average.
It is, after all, the second longest on record… and the second most intense.
If the magnitude of the bounceback approximates the magnitude of the cycle it ends… we can therefore expect a fantastic trampolining of rates.
That is, we can likely expect rate appreciations of 6% or more.
What Happens When Rates Rise?
The stock market and the decade-long economic “recovery” center upon ultra-low interest rates. And so we recoil, horrified, at the prospect of a “rapid, nonlinear” rate reversal.
We must next consider its impact on America’s ability to finance its hellacious debt…
A violent rate increase means debt service becomes an impossible burden.
How would America service its $23 trillion debt — a $23 trillion debt that jumps higher by the minute?
Debt service already represents the fastest-growing government expense.
Interest payments will total $460 billion this year, estimates the Congressional Budget Office (CBO).
CBO further projects debt service will scale $800 billion by decade’s end.
$800 billion exceeds today’s entire $738 billion defense budget. As it exceeds vastly present Medicare spending ($625 billion) and Medicaid spending ($412 billion).
CBO Doesn’t Account for Possible End to Rate Depression Cycle
But CBO pays no heed to the rate depression cycle. It — in fact — projects no substantial rate increases this decade.
But what if the present rate depression cycle closes… and interest rates go spiraling?
Debt service will likely swamp the entire federal budget.
Financial analyst Daniel Amerman:
If the interest rate on that debt were to rise by even 1%, the annual federal deficit rises by $200 billion. A 2% increase in interest rate levels would up the federal deficit by $400 billion, and if rates were 5% higher, the annual federal deficit rises by a full $1 trillion per year.
Recall, rates rocketed 6% or higher after two previous rate reversals.
Given the near-record intensity of the present rate depression cycle… should we not expect a similar rebound next time?
Hard logic dictates we should.
But what might bring down the curtain on the current cycle?
Unforeseen Catastrophe
Most previous rate depression cycles ended with death, destruction, howling, shrieking.
Examples, again, include the Black Plague, the Thirty Years War and World War II.
Perhaps a shock on their scale will close out the present cycle… for all that we know. Or perhaps some other cause entirely.
Of course, we can find no reason in law or equity why the second-longest, second-most intense rate depression cycle in history… cannot become the longest, most intense rate depression cycle in history.
The cycle could run years yet. Or it could end Friday morning.
The Lord only knows — and He is silent.
Regards,
Brian Maher
Managing editor, The Daily Reckoning


Comments: